
Page 19 - Render Apr.23
P. 19
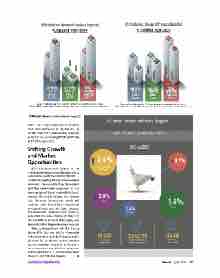
US Production, Rendered Products Imported % CHANGE 2021-2022 SUB-TOTAL FATS & GREASE Imports US Production, Rendered Products Exported % CHANGE 2021-2022 509.3 % 1,023.1 % 624.1 % 1,117.7 % 1,242.0 % 844.5 % 1,320.5 % 1,279.4 % 2,562.5 % 2,123.9 % 114.8 % 94.6 % B-TOTAL PROTEIN Imports T RENDERED PRODUCTS Imports SU MEALS U UB B TOTAL SUB-TOTAL FATS & GREASE Exports B-TOTAL PROTEIN Exports TOTAL RENDERED PRODUCTS Exports Sources: Trade Data Monitor, US Energy Information Agency for biodiesel inputs, USDA NASS - Fats and Oils: Oilseed Crushings, Production, Consumption and Stocks Summary US Market Report ��������� ���� ���� �� ����� ��� ������� �������� �� ������� ���� ��� ��������� �� ������ ��� �� ����� ���� ����� �������� �� ������� �� ������ ��� ���������� ������ ��� ����� �� ������� �� ������ ������� ������ and Market ������������ With the pandemic largely in the rearview window, demand is expected to �������� ��� ���� ���� ��� ��������� � thereby increasing demand for rendered products. Renewable Fuel Standards and the continued expansion of the biomass-based diesel sector globally will increase demand and prices for rendered fats. Demand for protein meals will ������� �� �� ������ �� ��� ��������� �� ����������� ��� ��� ���� �������� The expanded soybean crush capacity expected to come online in the U.S. will contribute toward the supply and ������ ���� �� ��� ������� ���� ������� ��� ������������� �� ��� ������ demand for fats and oils for renewable ���� ���������� ��� ��������� ������� demand for rendered animal protein due to changing consumer preferences ���������� ��� ���� �� ��� ��� ���� and markets for U.S. rendered protein products in 2023 and beyond. R www.rendermagazine.com Sources: Trade Data Monitor, US Energy Information Agency for biodiesel inputs, USDA NASS - Fats and Oils: Oilseed Crushings, Production, Consumption and Stocks Summary SU MEALS U UB B Render ����� ���� 17
