
Page 18 - Render_Feb23
P. 18
Life-Cycle Analysis ��������� ���� ���� ��
Carbon Footprint Comparison
with Vegetable �����������
��������� ���� ��� ��������� ��� ��������������� ����������� �� ������� ����� �������� ��� ����� ���� ������� � ������ ������ ��������� ���� ��� ����� ��� ������� � ��� �� ����� ���� ��� ������� ������ ������ ��� �� ��� ���� ��� ��������� ������������� ��������� ���� ��� �������
���� ��� ��� ��������� ��� ������ ���������� ���� ������������ �������� �� ��������� ���� ��� ����� ������� ���� ��� ���� �� ������ ����� �� �������� �� ��� ��������� ���� ����������� �� ���� ��� ������ �� ������� ������ ������� ��� ���������� ������� ��� ���� ��� ��� ���� ������ ��� �� ������� �� ��� ��������� ���� ��� ��� ����� �� ���� ��� �� ��� ����� �� ����������
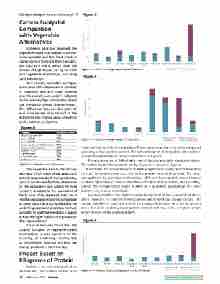
Figure 3
Figure 3 — Climate change impact of meal products
Figure 4
Figure 5
�������
����� ������� ���
������� ���
������� ���
����� ���� � ����� ������� ����� ���� � ������� ������� ����
��� ���� ���� �������� ���� ������� ����
������� �������
��� ��� ��� ��� ��� ��� ��� ��� ���
Figure 4 — Climate change impact of oil products
��������� �������� �� ���� ����������� ������� ������� ��� ��������� ���� �������� ��������� �� ����� ������� �������� ��� ������ ��������� �� ��� ������������ �������� �� ����� �� ��������� �� � ��� �� ������� ����� �� ������ ��
��� ������� ������� �� ���� �� ������ ������� ���� ��� ��������������� ������������ ��� ������ ��������� �� �������� ��� �� �� ������� �� ����� �� ������ ��
����������� ��� ������ ��������� �� ���� �� ������ �� � ��� �� ������� ����� ���� �� � ��� �� ������� ���� ����� ��� �� ��� ������� ������� �� �� ������ ��� ���� ���� ������� �� ��� ����������� ������������ ���� ���� ����� ������� ������� ���� � ��������� ������ ������ �������� ���� ����� �� ������ ������� �������� ��� �� �������� �������� ��� ������������� ������ �� ���� �� � �� ������� ����� ������� ��� ���� ������ �� �� ������� ���� ������
������� ���� ��� ��� ������� ������ ��������� �� ��� ��� ��������� �������� ���� �������� ��� ������� ���� ��������� ����� ���� ��� ������ ������� ��� ������ ��������� �� �������� ���� �� ���������� ������������ �� � ��� �� ������� ������ ��� �� ��� ��������� ����� ������� ������� ��� ����� �� ��� � ������ ������ ��������� ���� ��� ��� ��������� �����
Figure 6
Figure 5 — Protein content of products
��� ��������������� ������������ ���� ���� � ���� ����� �� ��� ������������ �������� ���������� ���� ����� ���������� ����� �� ��� ��� ���� ��� ����� ����� ���� �� ��� ����������� ��� ������ ������� ������ �� ��������� �� ��� ��������� �� ����� ����� ���� �������� ���� ��� � ��������� ��� ������ ���������� ���������� �� ���� ����� ���� �� ������ ������� �� ��� ���������� �������� ��������� ������� ��������� �� ����� �������� ��� �� ��������� � ��������� ������ ������ ���� ��������� ���� �������� �����
�� ��� �� �� ���������� ���� ��� ������ ��������� �� ��������������� ������������ �� ���� ��������� �� ��� ��������� �� ���������� ������� ��� �� ��� �������� ���� ��� ��� ���� ��� ������ �������� �� ���� ��������
Impact Based on Kilograms of Protein
������� �� �� ��������� ���� �� �� �������� ����� ��� ������� ������� �� ��
16 �������� ���� Render
Figure 6 — Carbon footprint of products per kg of protein
����������������������
